
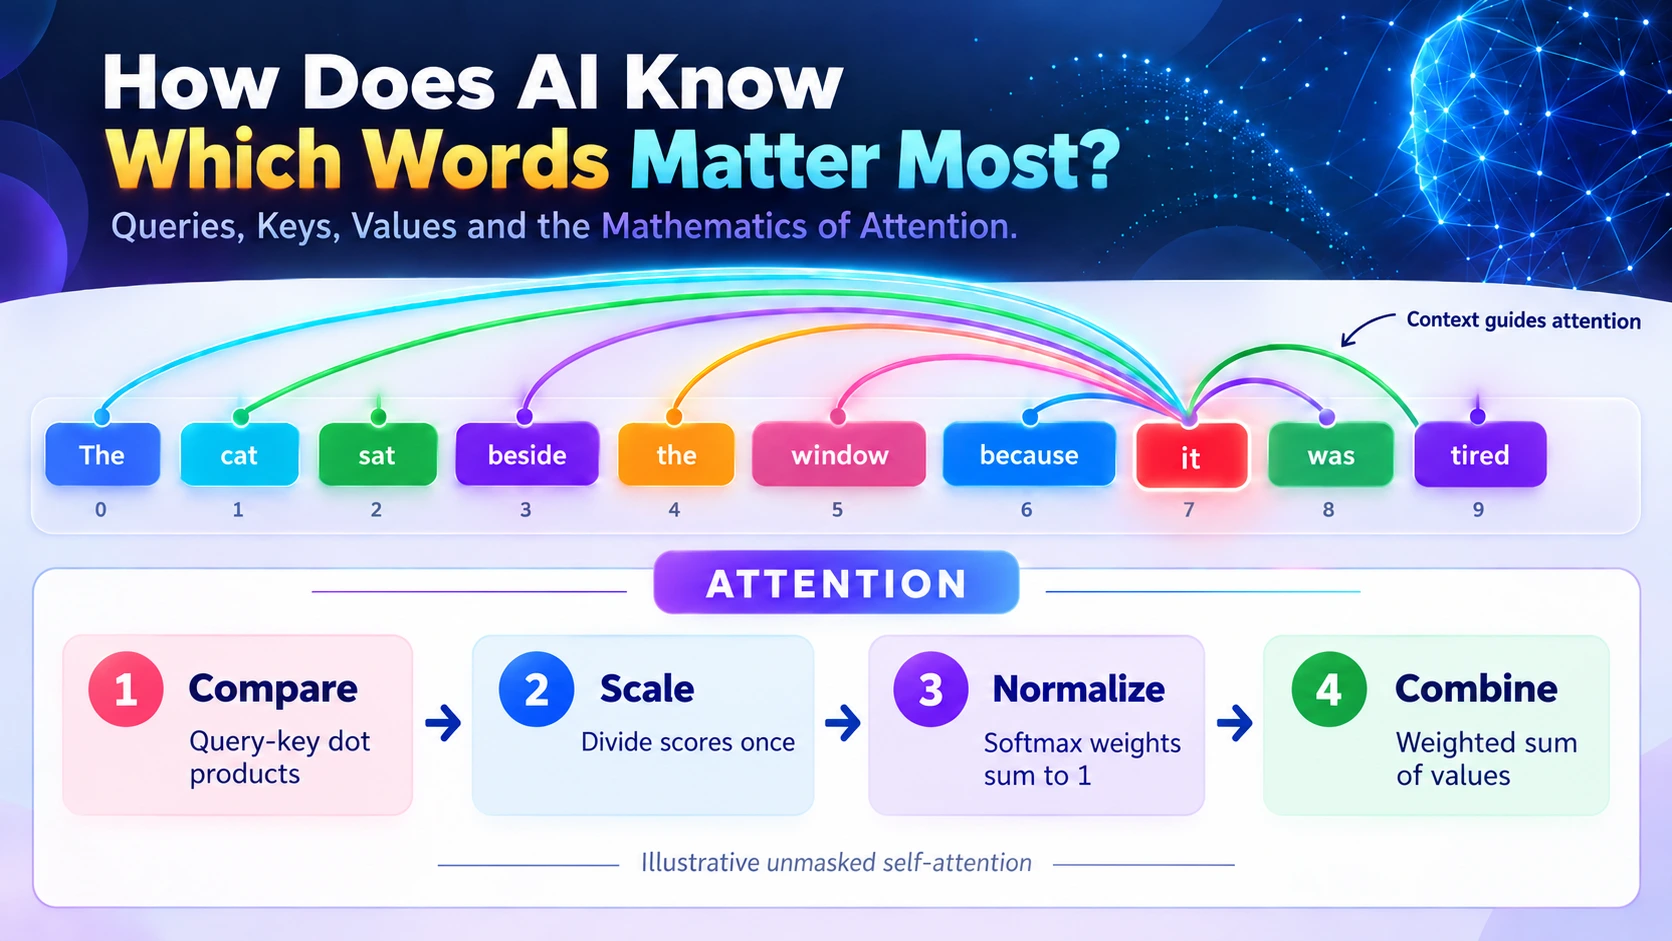
Queries, Keys, Values and the Mathematics of Attention
Read this sentence:
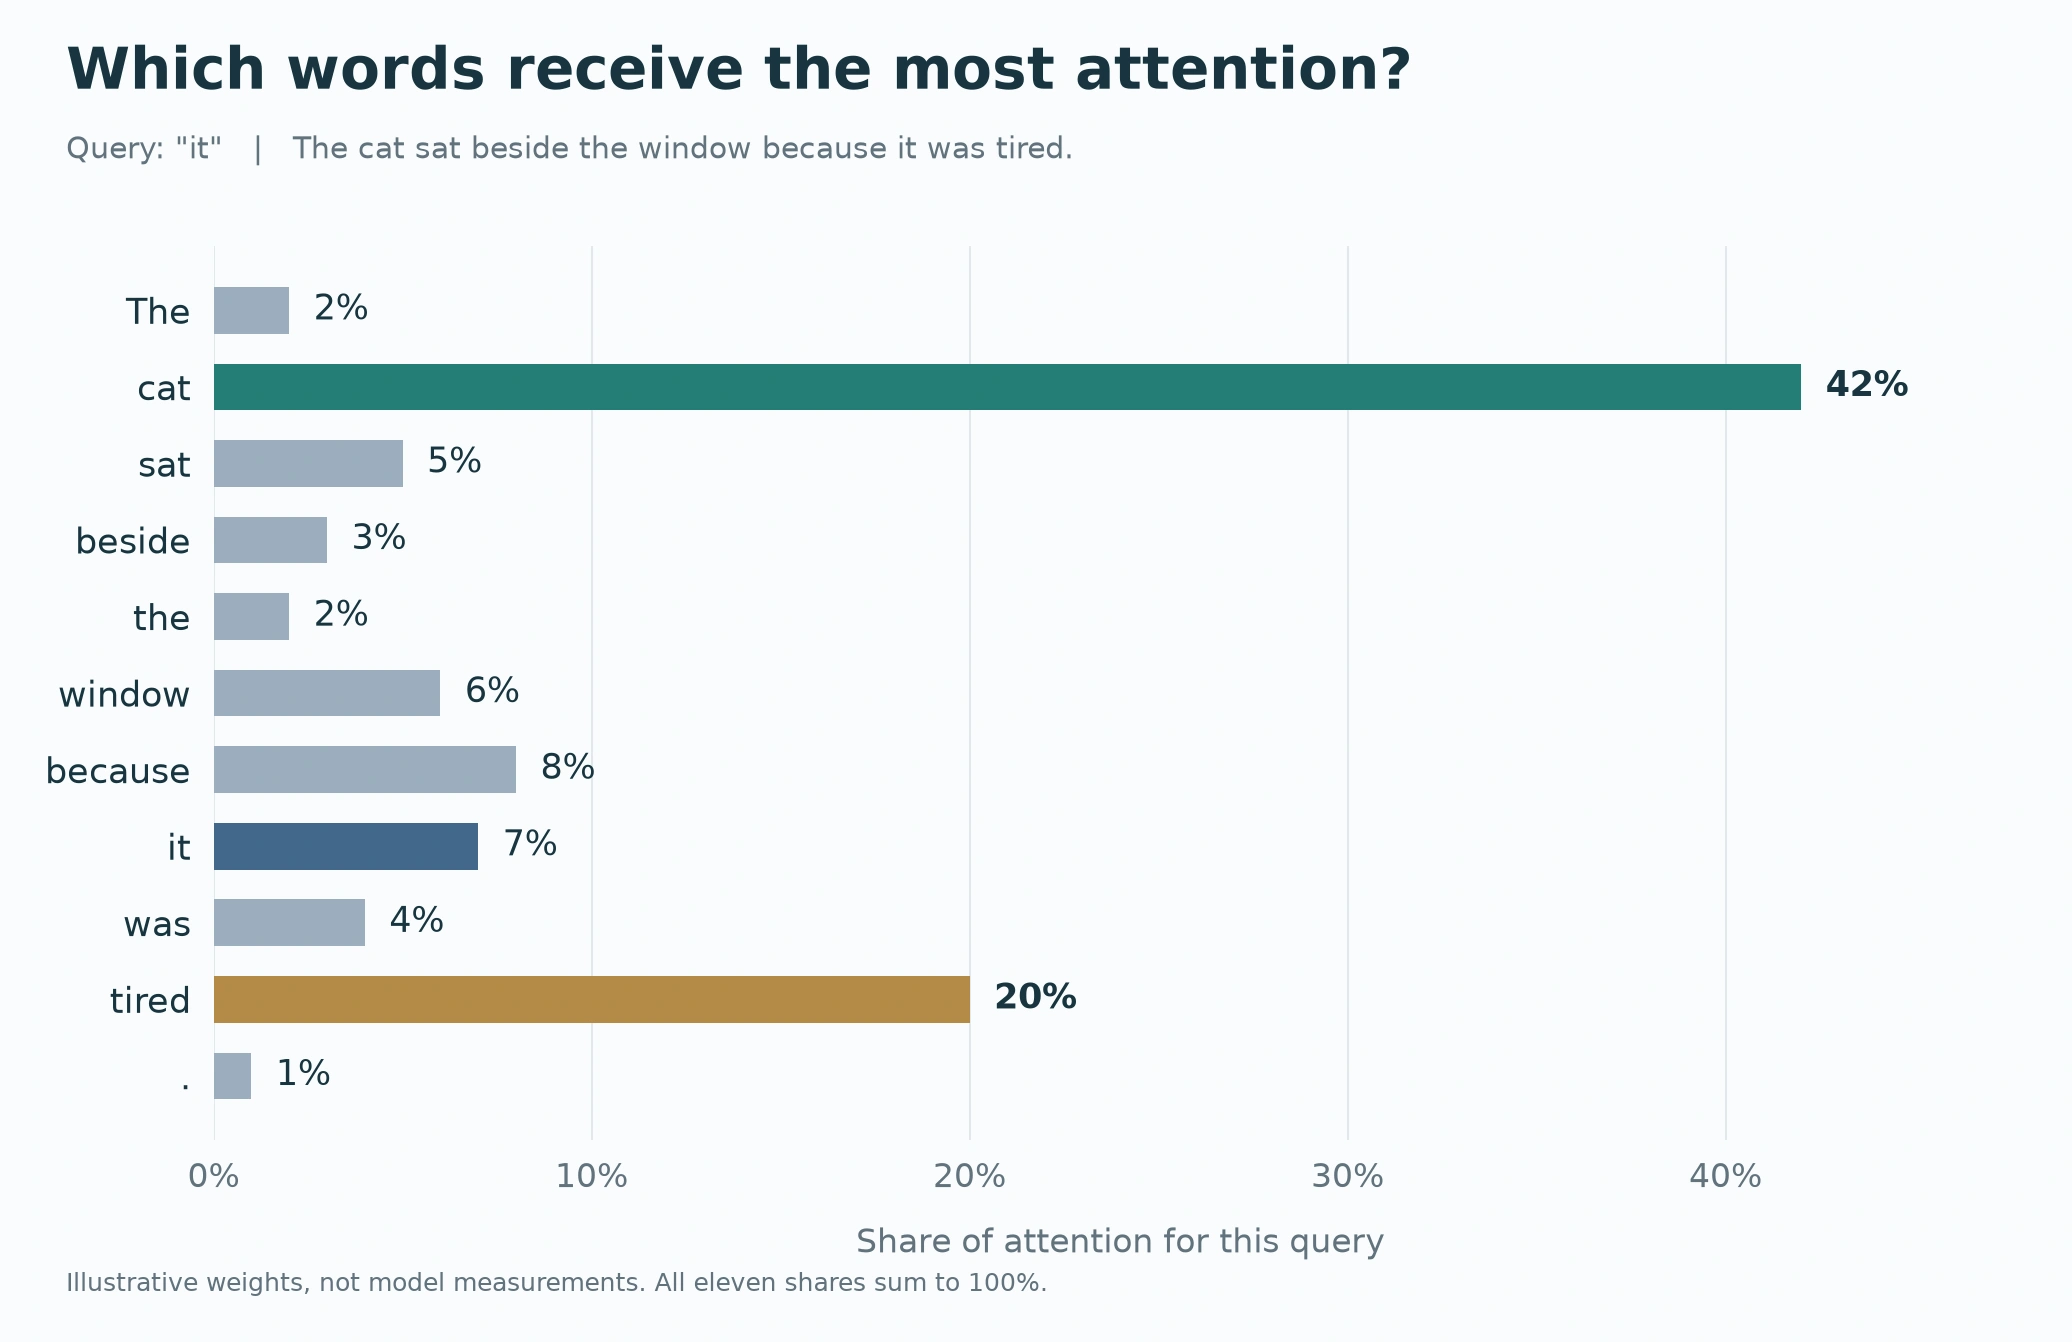
“The cat sat beside the window because it was tired.”
When you reach “it,” who do you think of? The cat, almost certainly. Not the window.
You make that connection without drawing a diagram or calculating anything. An AI model has to build useful connections from numbers. So how does it decide which words deserve more attention?
The answer brings together a few familiar mathematical ideas: vectors, dot products, scaling and weighted averages. But before we look at a formula, let us follow the story.
Not Every Word Matters Equally
In our sentence, “cat” helps us interpret “it.” The word “tired” gives another clue. “The” is part of the sentence too, but it plays a different role.
Attention gives a model a way to gather different amounts of information from different places. Instead of mixing every word equally, it asks: “For the word I am processing now, which other words would be useful?”
One small detail: models actually work with tokens, which can be words, parts of words or punctuation. We will use whole words here to keep the story easy to follow.
Queries, Keys and Values: Think of a Library
Imagine walking into a library with a question. You compare your question with the labels on the shelves and books. Once you find something useful, you read the information inside.
Attention gives each token three related jobs:
- Query: the question - “What information am I looking for?”
- Key: the label - “What might make my information relevant?”
- Value: the contents - “What information can I pass along?”
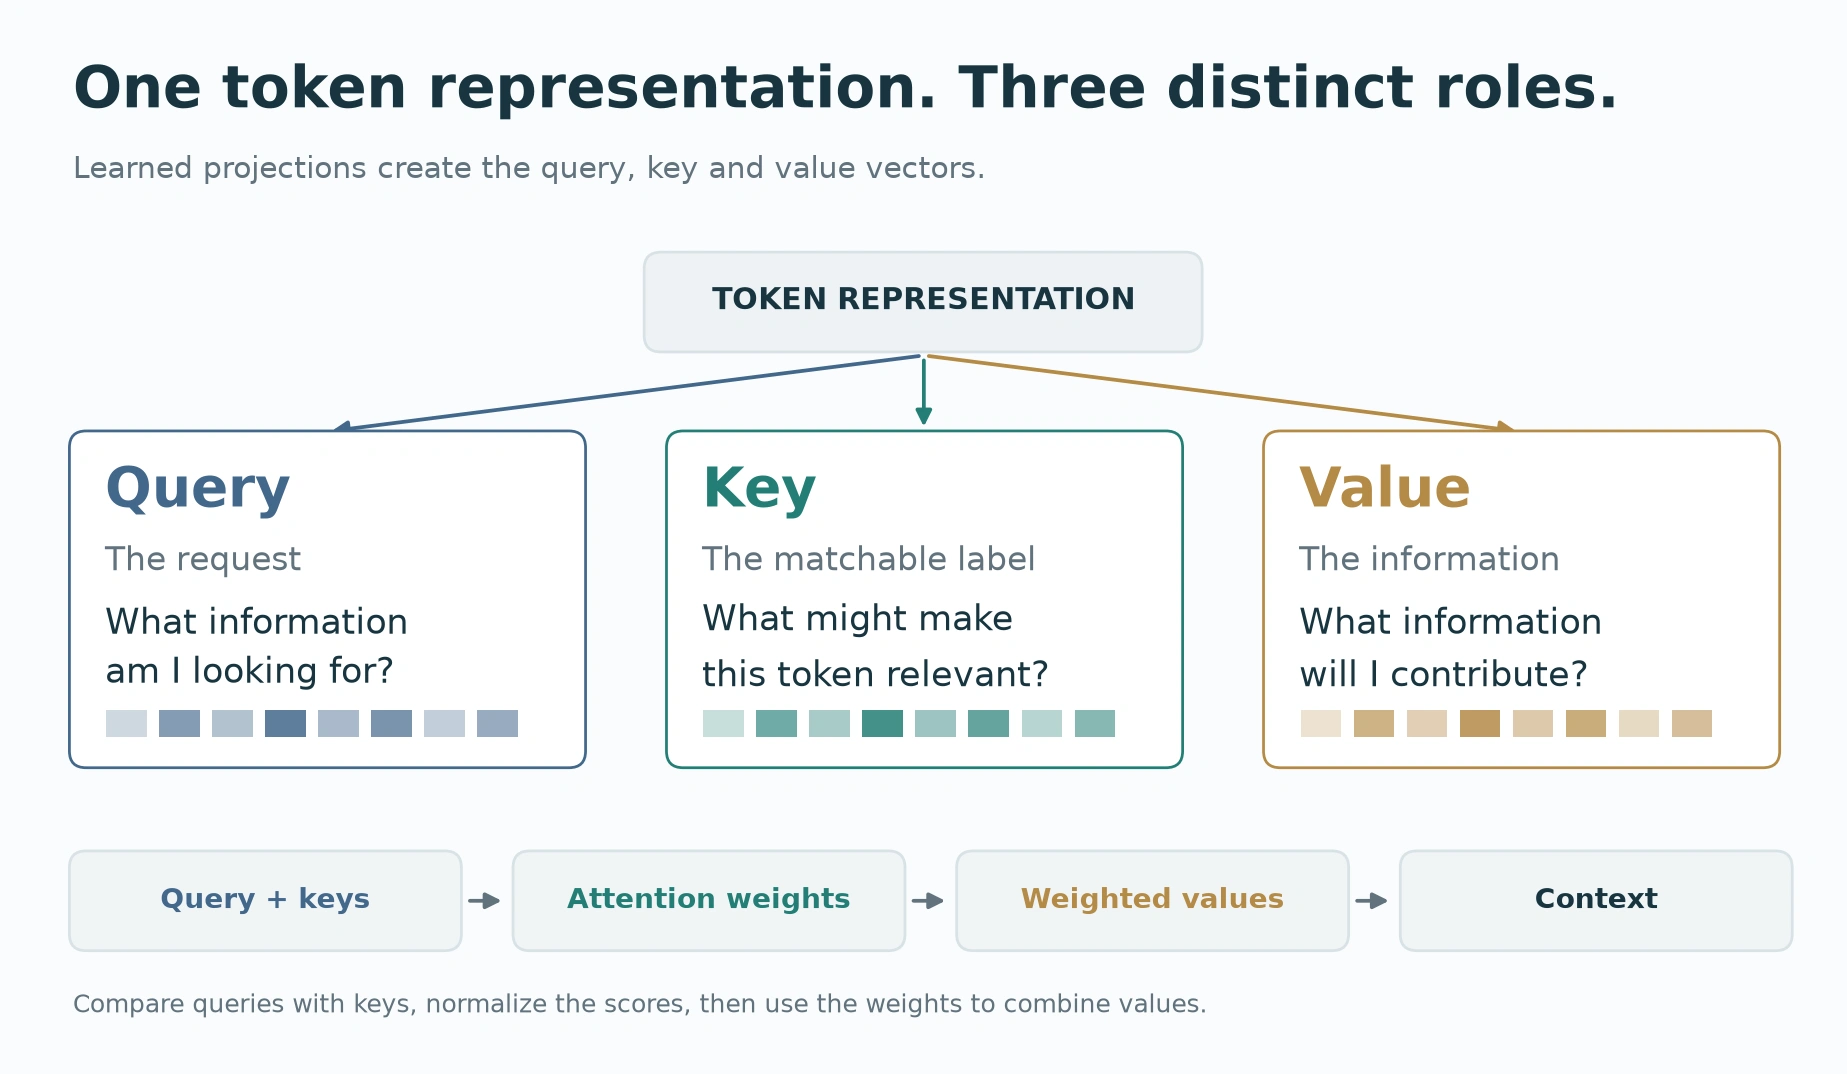
These are not three separate dictionaries that someone writes by hand. The model creates query, key and value vectors through learned transformations of the token’s representation.
The same word can therefore help ask a question, offer a match and contribute information. Three roles, one starting point.
A Dot Product Helps Find a Match
Now imagine the query for “it” comparing itself with the keys for the other words. How does a computer measure whether two vectors are a useful match?
One answer is the dot product: multiply corresponding entries, then add them up.
A higher score gives that query-key pair a stronger match within the attention calculation. Both the vectors’ direction and their size matter. It is a learned compatibility score, rather than a direct measure of how similar two words sound to us.
That is the first mathematical bridge: a relationship between words becomes a comparison between vectors.
Why the Model Turns the Volume Down
A dot product adds many terms. With longer vectors, the resulting scores can spread out more. One score may become so large that it drowns out the others before the model has a useful balance of information.
Think of a group conversation where one microphone is turned up much too high. You can still hear a voice, but the conversation has become harder to follow.
Attention scales the scores before turning them into weights. In standard scaled dot-product attention, it divides by the square root of the query/key dimension, written .
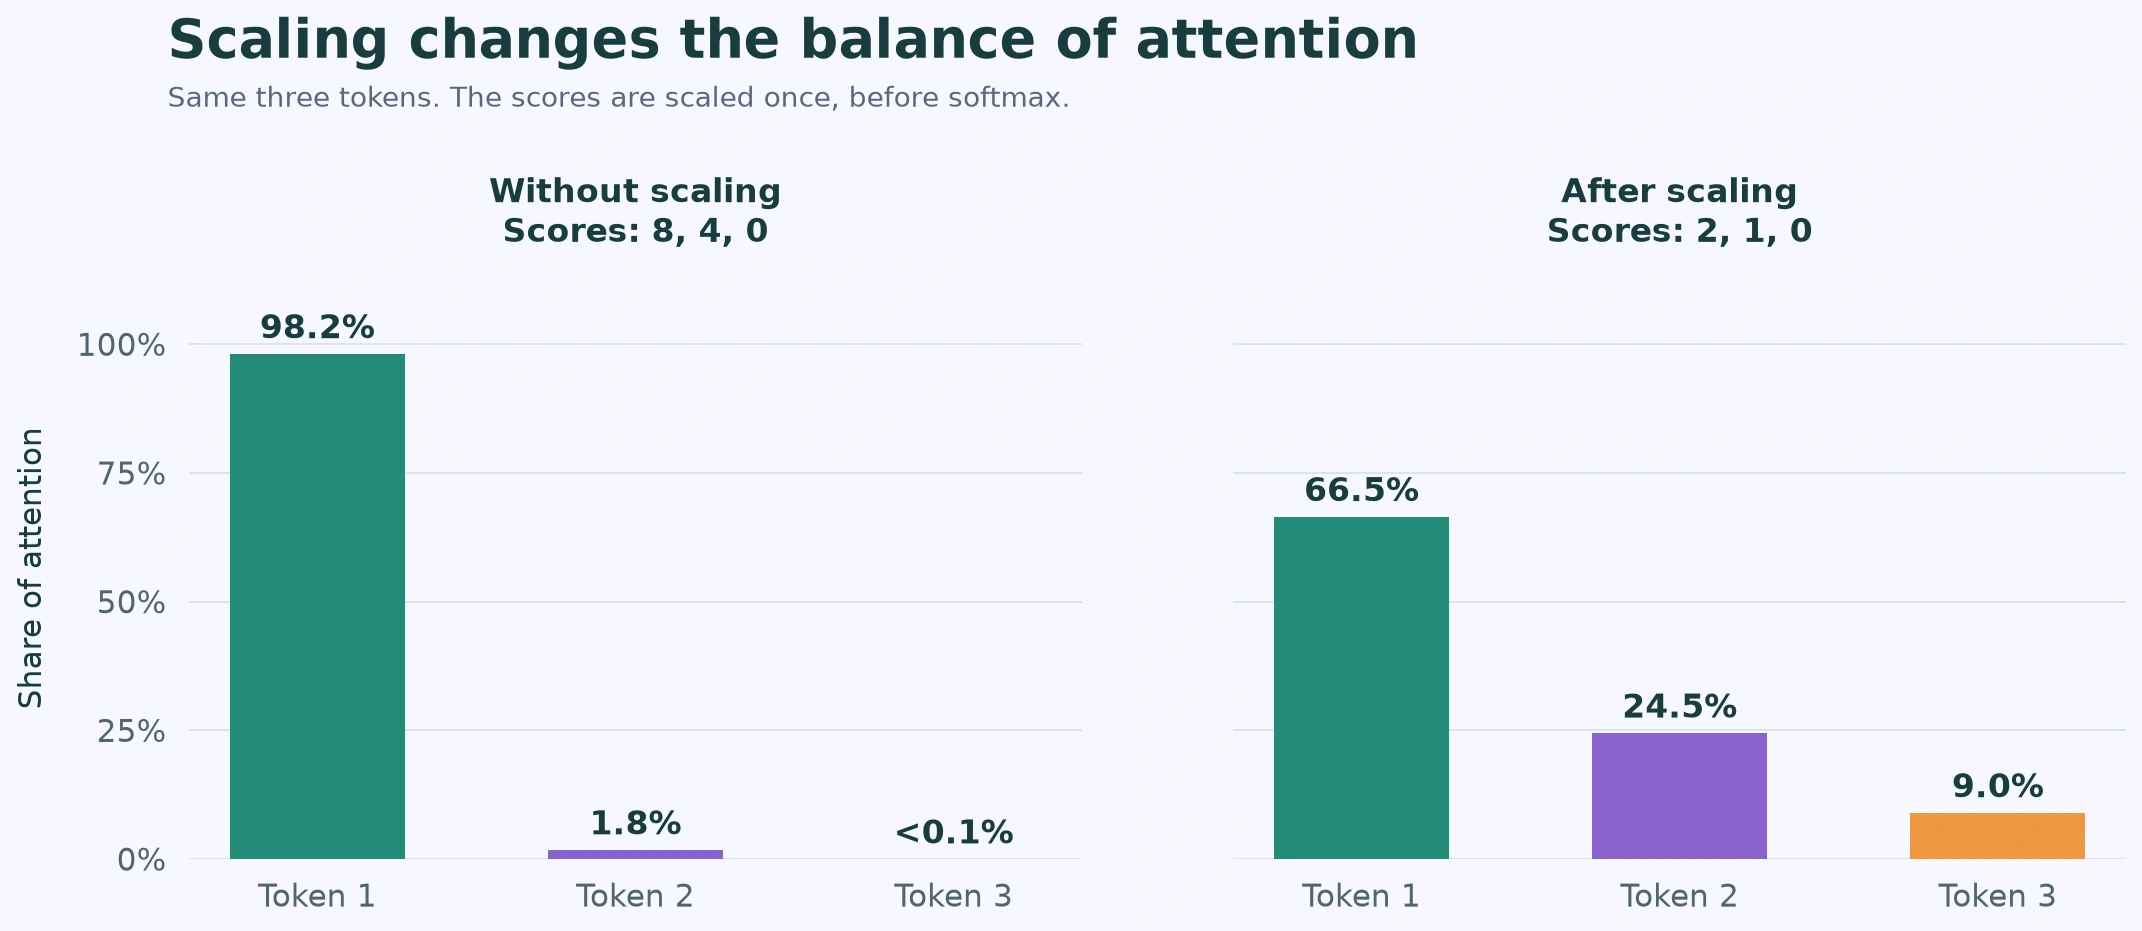
That small-looking division has a practical purpose: it helps keep the score scale under control during learning. The scores are scaled once.
Softmax Turns Scores into Shares
We have compatibility scores, but a score is not yet a share of attention. Softmax turns the available scores into positive weights that add up to one.
For scores [2, 1, 0], the shares are approximately:
- Token 1: 66.5%
- Token 2: 24.5%
- Token 3: 9.0%
You can see these shares in the right-hand chart above. The largest score gets the largest share, while the others still contribute.
The word share is useful here. These percentages describe how information will be mixed. They are not confidence scores saying that one word is “66.5% correct.”
Values Are the Information That Gets Passed Along
Finding a promising book is not the same as reading it. In the same way, calculating attention weights is not the end of attention.
The model uses those weights to combine the value vectors. A token with a bigger weight contributes a larger share of its value vector to the mixture.
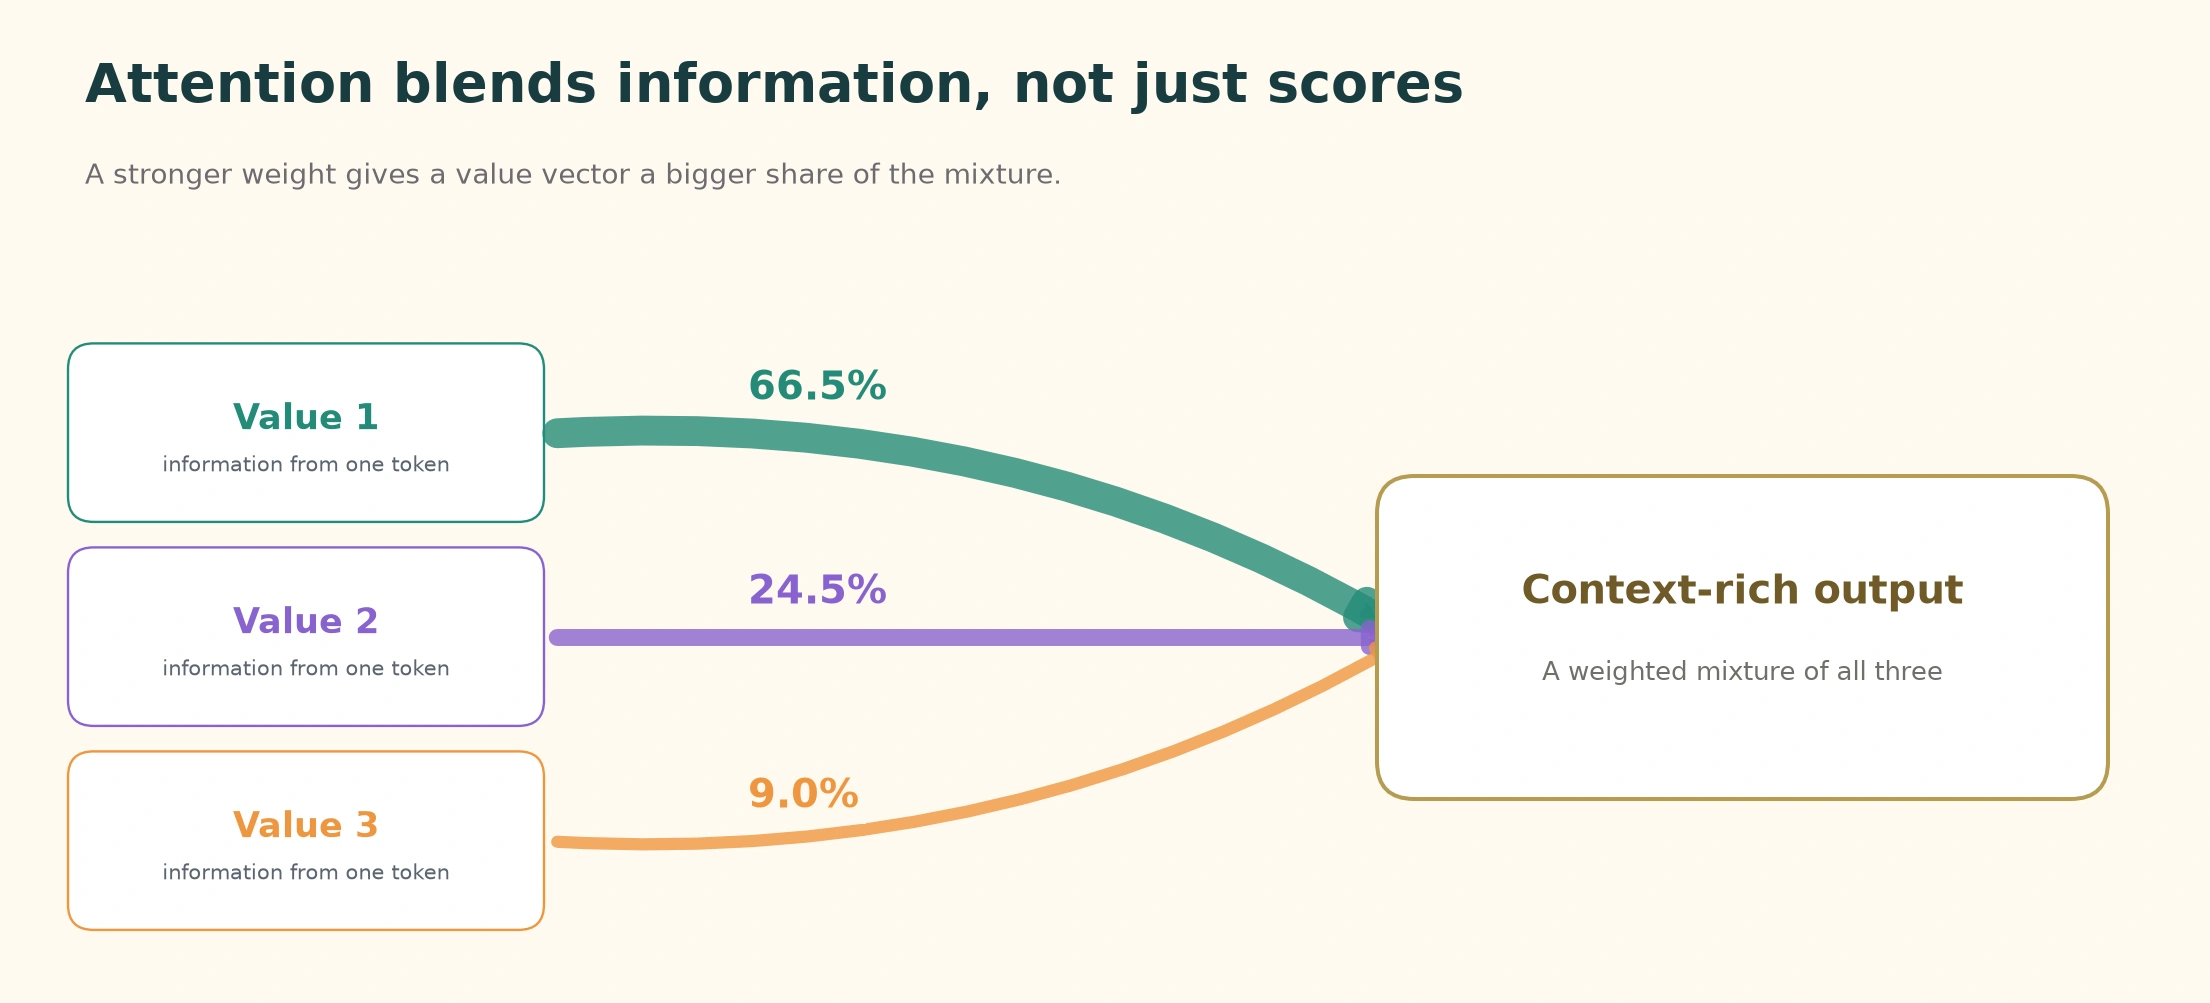
The mathematical idea is a weighted sum:
Here, each is a weight and each is a value vector. In everyday language: take some information from here, more from there, and blend it into a context-aware output.
That is more interesting than simply declaring one word “important.” Attention actually moves information between representations.
The Famous Equation, Now with a Story Behind It
You may have seen this expression before:
It becomes less intimidating when we read it as four actions:
Compare → Scale → Normalize → Combine
Compare queries with keys. Scale the scores. Use softmax to turn them into shares. Combine the values using those shares.
The capital letters collect the vectors for several tokens into matrices, allowing the model to perform many comparisons together. Softmax works across the available keys for each query separately.
You do not need to memorize the notation to follow the idea. Attention is a way of deciding how to mix information.
Why Is It Called Self-Attention?
In self-attention, the questions, matching labels and information all come from the same sequence. Every word can build its own view of that sequence.
The chart below makes this visible. Pick a row, then look across it. That row shows one token’s attention pattern. Darker squares indicate stronger weights.
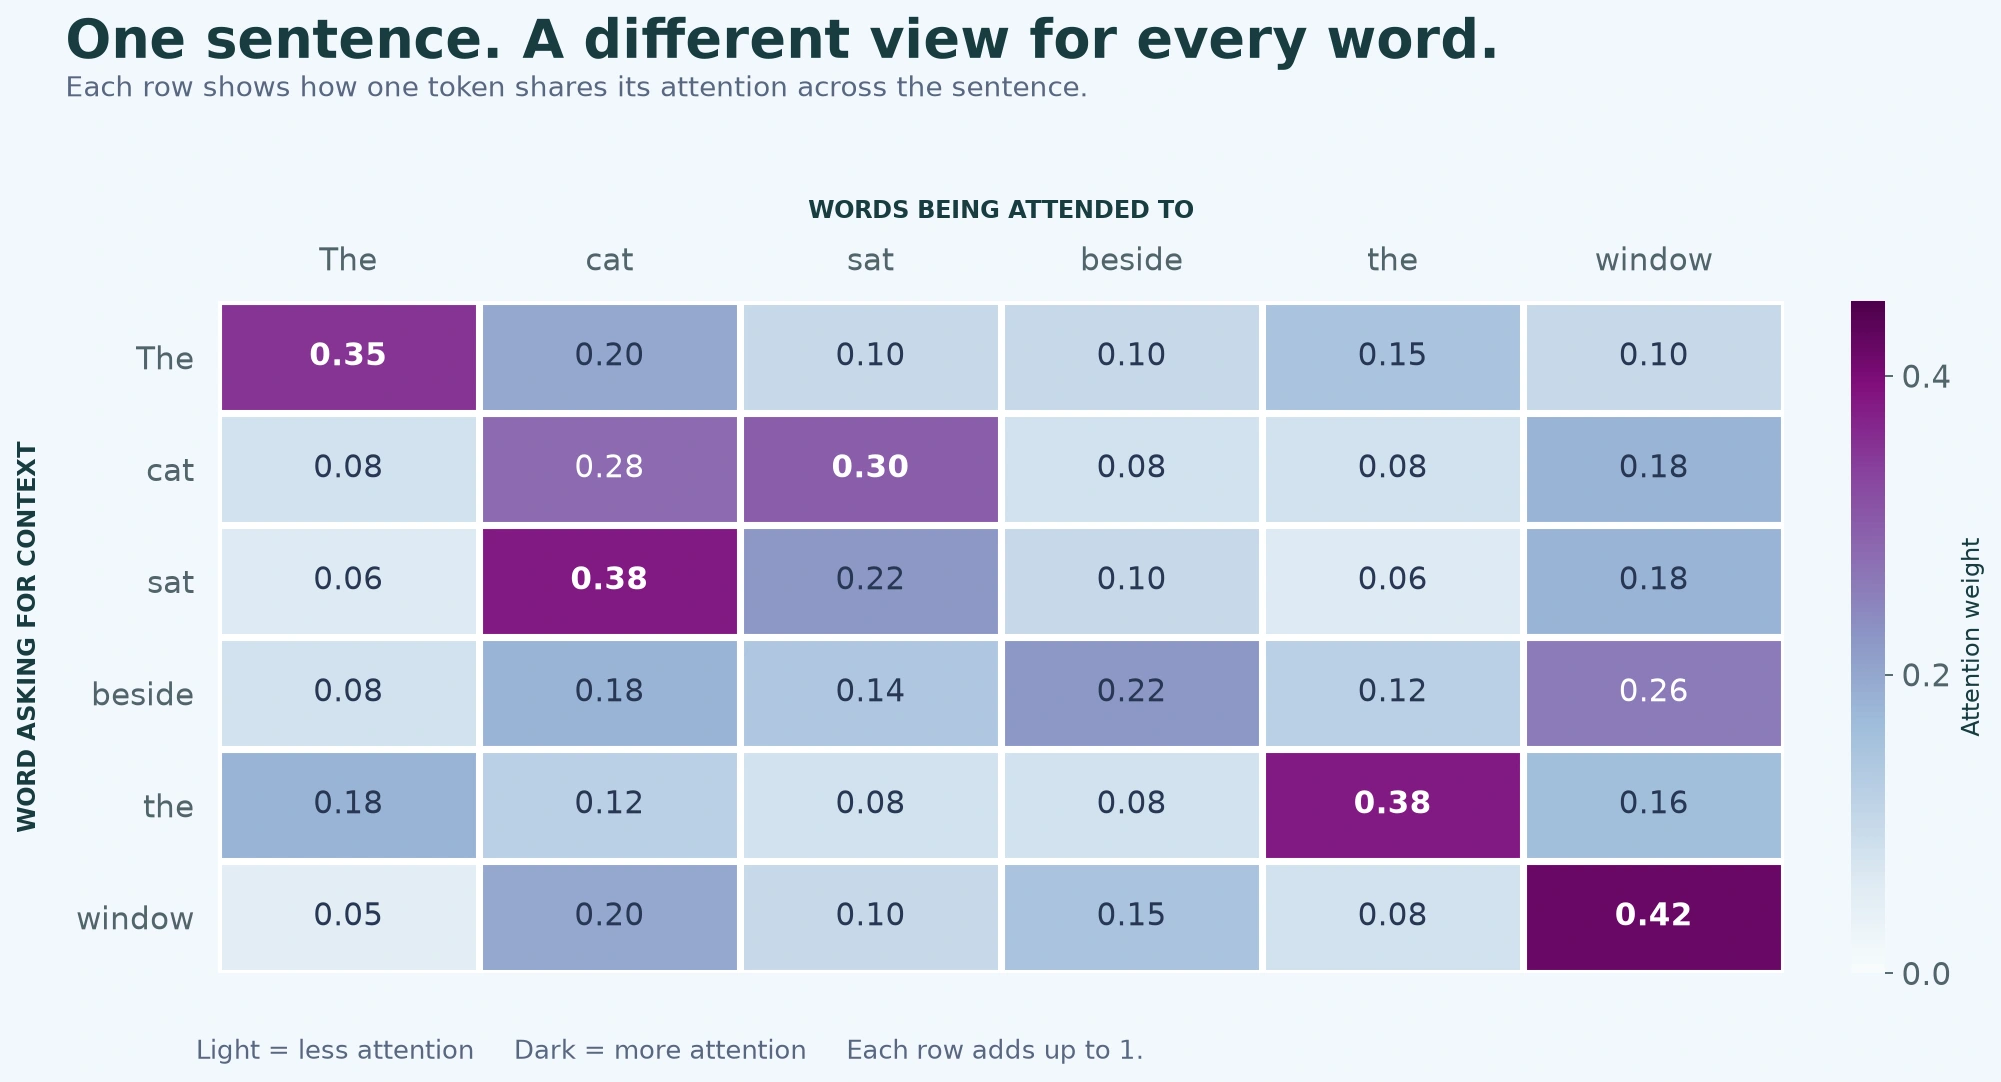
Notice how “cat” and “window” have different patterns. They are processing the same sentence, but they need not gather the same mixture of information.
There is also an important distinction. An unmasked model can use words on both sides. A causal language model can use only the current token and earlier ones; future positions are blocked before softmax. It cannot peek at words that have not appeared yet.
One Sentence, Several Lenses
What if more than one kind of relationship matters? A sentence may contain local grammar, related meanings and a connection between words that are far apart.
Transformers use multiple attention heads to learn several views in parallel. Each head has its own learned transformations. Their outputs are brought together afterward.
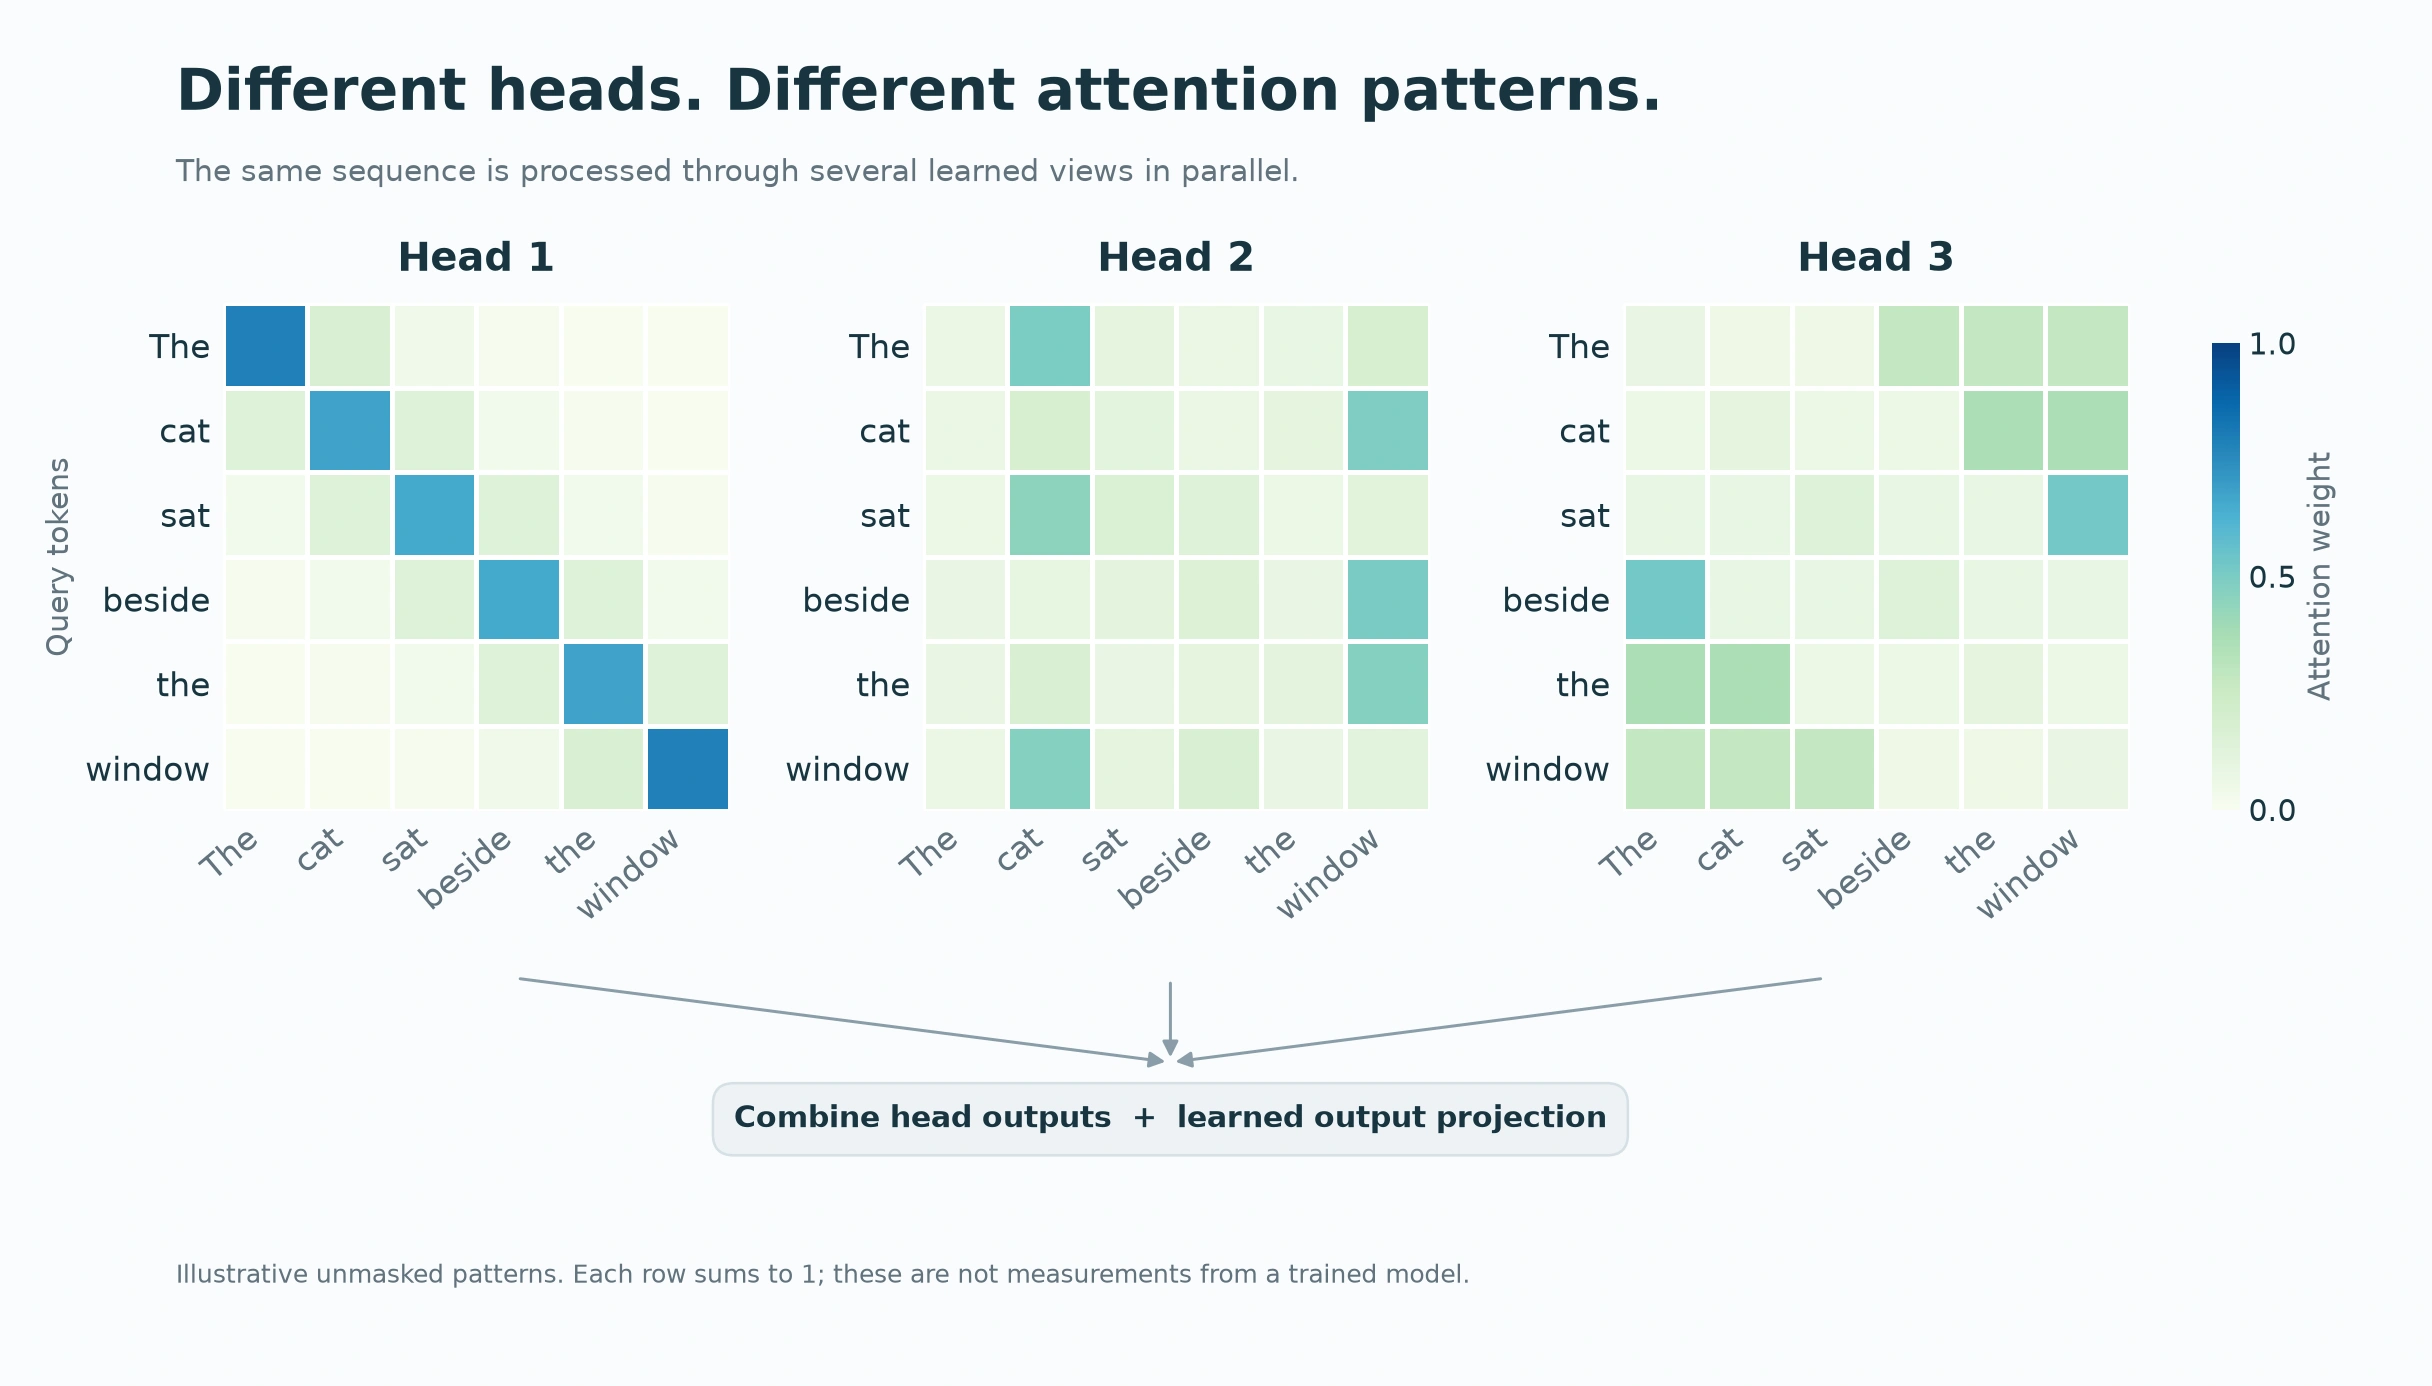
The useful picture is one sentence, several lenses. A head is not guaranteed to become “the grammar expert” or “the meaning expert.” The patterns emerge through learning and can overlap.
Attention Needs a Sense of Order Too
Compare “Dog bites man” with “Man bites dog.” Same three words. Very different afternoon.
Comparing token content alone is not enough to represent that difference. Transformers also include position information, through methods such as positional encodings or rotary position embeddings. Masks can constrain which positions interact too.
Attention helps decide what information to gather. Position helps represent where the words occur.
Does Attention Tell Us Why the Model Answered?
An attention map can be revealing, but it is only one part of the picture. A Transformer has many layers, many heads and other transformations that change what happens next.
So a dark square in a heatmap does not, by itself, prove “this is why the model gave that answer.” The value vectors and the rest of the model matter too.
Attention maps help us explore a computation. They are not automatically a complete explanation of it.
The Bigger Idea
We began with a simple question: “How does AI know which words matter most?”
It does not begin with human intuition. Through training, it learns representations that let some relationships receive stronger scores. Those scores become weights. The weights help build a useful mixture of information.
Words → Vectors → Relationships → Weights → Context
That is the fascinating part. Something that sounds so human - paying attention - becomes a sequence of mathematical operations we can understand, visualize and check.
Learning with Purpose
At The Learning Studio, this is the kind of connection I want learners to experience. A question about an ordinary sentence opens a door to vectors, dot products, weighted averages and eventually Transformers.
We do not have to start with a page full of notation. We can start with a cat, a window and a small word: “it.” Then let the mathematics explain the connection.
Coming Next
Why Does AI Need So Many Layers?
From Simple Features to Deep Representations: The Mathematics Behind Depth in Neural Networks
One layer can transform information. So why stack dozens, sometimes hundreds, of transformations? What can another layer add? And why is combining many simple transformations so powerful?
That is where we go next.
Curious to Read More?
The original Transformer paper, Attention Is All You Need, develops the mathematics behind these ideas. For the discussion about interpreting attention, see Attention is not Explanation and the follow-up Attention is not not Explanation.